Using My Developers to Understand API Usage and Debug Issues
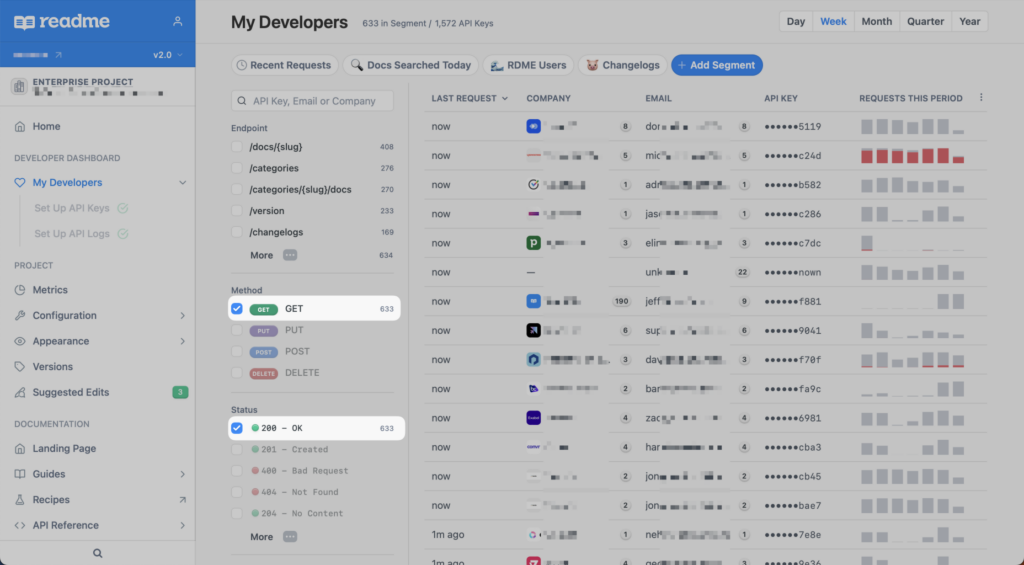
After setting up Developer Dashboard, you’ll notice that there’s a new My Developers page in your dashboard. This area gives your team in-depth developer profiles and API usage analytics. Here, your team can dig into API usage, quickly debug issues, track performance, and share aggregate findings and learnings with key stakeholders.
You can filter by API key, email, or company, see portions of the data based on API endpoint, method, status, and more, and create segments that live at the top of the page so you and your team can easily locate and reference them. This suite of tools gives your team the backend interface to see who’s having issues, identify fixes, and seamlessly support your developers to get them back on track.
The magic of filters and segments 
The rich insights that you can unlock with My Developers is powered by your real-time API request logs, which ReadMe aggregates and surfaces once you’ve integrated the Metrics SDK. Once you can see all of the logs, the magic of My Developers lies in filters and how you slice and dice the data 
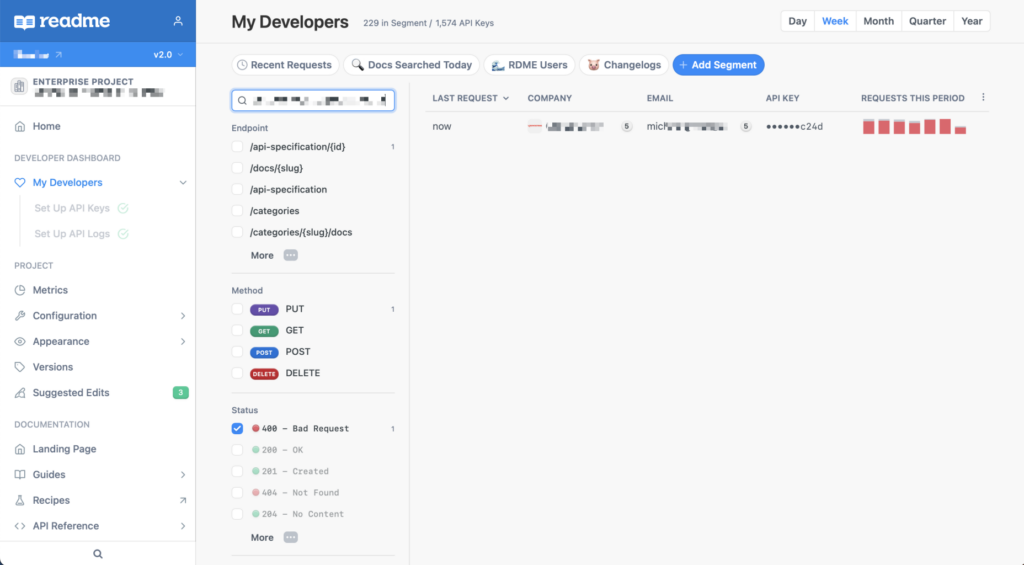
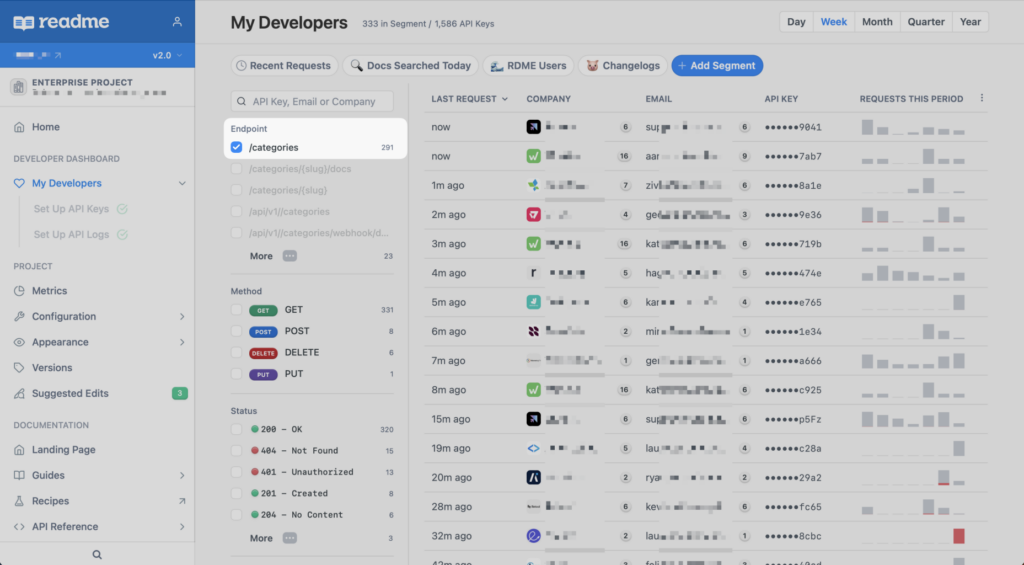
Using the filters and search functionalities, you’re able to hone in on certain endpoints, methods, status codes, and user agents, and further distill your findings by time period (day, week, month, quarter, year). From there, you can build and save segments to monitor usage of your APIs and keep a closer eye on certain cohorts of API users:
- Track developers who are encountering lots of
 HTTP error codes within a short time frame, and proactively reach out to offer a helping hand
- Make the call on how to handle a spike in API call volume with all of the insights and usage data in front of you

- Create a segment based on a recently launched endpoint to track usage and get feedback on how your developers are using it

Hone in on specific user problems 
The My Developers page unlocks replay functionality for you and your team, so you can accurately diagnose and triage an issue, and offer direct support. Let’s say your support team receives a message from a developer who’s hit a snag while using your API. Thanks to My Developers, you can instantly find them by filtering on the developer’s API key or email address, jump straight into their logs, get a clear sense of why they’re having trouble, and offer solutions for how to remediate the issue 
Be prepared for emergencies 
Shipping a new version or need to deprecate an endpoint? My Developers makes it easy to diagnose who will be impacted so you can proactively reach out and help them through the transition.
And, while we hope your team never has to deal with a security incident, in the event of something like an API key leak, you can quickly pull a list of keys that were active during the affected time period for communications around revoking and rotating their keys. You’ll be happy to have the tooling in place to support your team in these moments, infrequent as they may be — hope for the best, plan for the worst!
Where’s the data coming from? 
The data that you see in your My Developers page is pulled from two sources:
- Try It requests made in your ReadMe developer hub
- API request data that you send to us (once you’ve integrated the Metrics SDK)
Your ReadMe plan includes up to 24 hours worth of API History (including Try It data) for free. To see any API request history beyond 24 hours, you’ll need to purchase additional API logs per month. Logs can be for $399/month for 25M logs. For more info about purchasing API logs, check out this page.
Any questions?
For a full guide to setting up Developer Dashboard, head over to this page in our docs. And of course, if you have any specific questions, feel free to reach out to our support team!